Isopleths are also called contour lines and are very helpful in showing elevation among others. In the case above, the lines are used to connect areas with similar hydrogen ion concentration.
Digital Raster Graphics are scanned or georectified USGS topoquads. They include all information from the scanned map. They can include contours, locations and buildings.
A Digital Line Graph is a feature represented in digital vector form. It is a file type that can contain a lot of information like topography, hydrography, boundaries, roads and contours. Many are made and distributed by the USGS.
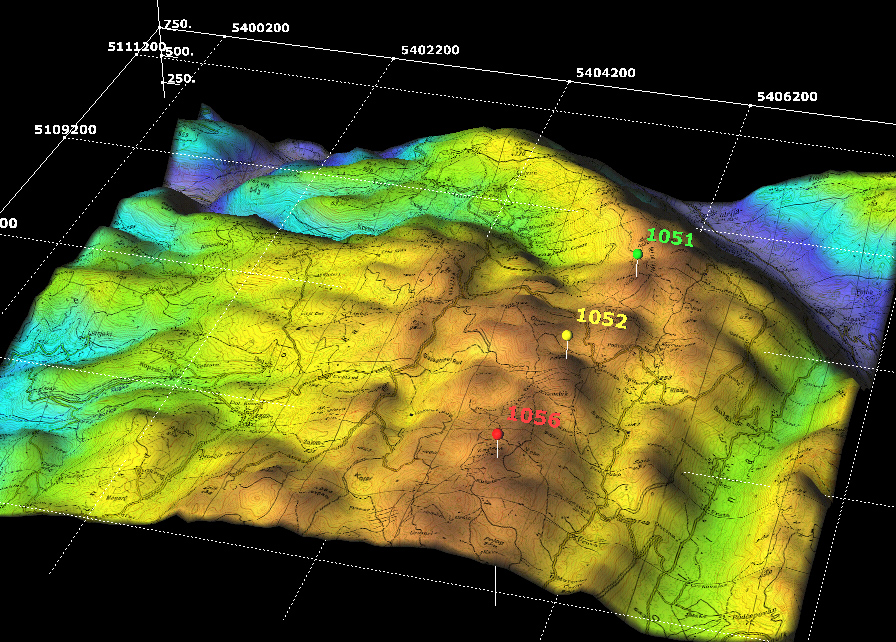
Digital Elevation Model maps display elevation data in either digital or 3D form. Remote sensing is used to collect the information and then colors are used frequently to further show the distinction in elevation.
Digital Orthopho Quarter Quads are maps created by the USGS with uniform scale and orthorectified aerial images. Measurements can be made directly from the map without image distortion thanks to the technique of ractifaction used in these maps.
Unclassed choripleth maps are know for having continuius color intensity without set intervals. Every value is a different color so numerous shades will be present. Sometimes this can be challenging as shades tend to blend together at some point.